
Incorrect Grid Lines in Map_Grid
QUESTION: I notice that if I draw map grid lines with Map_Grid on a map projection space I set up with Map_Proj_Init that I often get extraneous or incorrect grid lines.
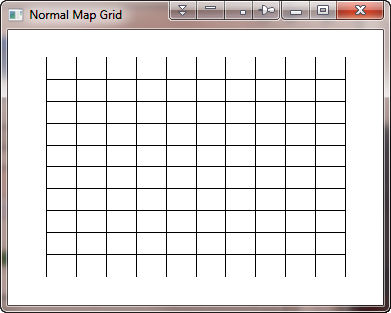
Here, for example, are two plots that use exactly the same map projection (Cylindrical) in exactly the same way, but produce two different grid results, as you can see in the figure below. The only difference is that one map projection space is set up with Map_Set and the other is set up with Map_Proj_Init You see the problem on the right-hand side of the second figure. A second, less serious, but still annoying, problem can be seen at the left of the figure, where the left-most vertical line is missing in the figure on the right.
   lons = -180 > Indgen(11)*36-180 < 180
   lats = -90 > Indgen(11)*18-90 < 90
   cgDisplay, WID=0, Title='Normal Map Grid', 375, 275
   Map_Set, /Cylindrical, Position=[0.1, 0.1, 0.9, 0.9], /NoBorder, /NoErase
   Map_Grid, lats=lats, lons=lons, Color=cgColor('black'), GLineStyle=0

   cgDisplay, WID=1, Title='Abnormal Map Grid', 375, 275
   m = Map_Proj_Init('Cylindrical')
   cgPlot, [0,1], XRange=m.uv_box[[0,2]], YRange=m.uv_box[[1,3]], $
      XStyle=5, YStyle=5, /NoErase, /NoData, $
      Position=[0.1, 0.1, 0.9, 0.9]
   Map_Grid, lats=lats, lons=lons, Map_Structure=m, Color=cgColor('black'), GLineStyle=0
 |
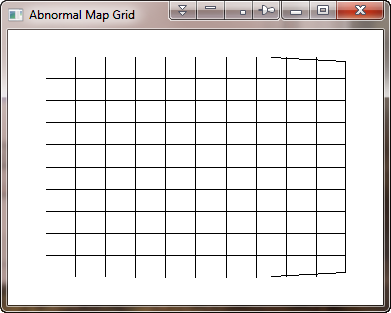 |
| Map_Grid includes extraneous lines in the figure on the right, created with Map_Proj_Init. | |
![]()
ANSWER: This is just one of several problems Map_Grid has. This one appears to be caused by a bug in the Map_Proj_Forward command in IDL.
Map_Grid, of course, uses the map structure created by Map_Proj_Init to convert latitude and longitude values to projected meter space with the Map_Proj_Forward command. Ordinarily, this command is very accurate, but if the POLYLINES keyword is used with Map_Proj_Forward, as it is in Map_Grid, then the projected meter values become corrupted in some cases. This is what is causing the extraneous grid lines in this case.
Here is an example that illustrates what I mean.
   IDL> lons = [-180, -90, 0, 90, 180]
   IDL> lats = Replicate(90, 5)
   IDL> m = Map_Proj_Init('Cylindrical')
   IDL> uv = Map_Proj_Forward(lons, lats, Map_Structure=m)
   IDL> Print, uv[1,*]
          10007539.
          10007539.
          10007539.
          10007539.
          10007539.
   IDL> uv = Map_Proj_Forward(lons, lats, Map_Structure=m, Polylines=p)
   IDL> Print, uv[1,*]
          10007523.
          10007523.
          10007539.
          10007539.
          10007539.
          10007539.
          10007523.
You can see that using the POLYLINES keyword causes the return values from Map_Proj_Forward to contain incorrect values and that there are more values output than are put into Map_Proj_Forward!
It is these incorrect values that are being plotted in the figure on the right to produce the extraneous lines that you see there.
This and other problems with Map_Grid (the vertical line problem has also been solved) have been corrected in the program cgMap_Grid, which is one of about a dozen or so map projection routines available for the Coyote Graphics Library.
![]()
Version of IDL used to prepare this article: IDL 8.1.
![]()
![]()


