
Navigating an Ice Shelf Image
QUESTION: I am trying to navigate or set up a map coordinate system for an ice shelf image I found on the National Snow and Ice Data Center's (NSIDC) Antarctic Ice Shelf web page. I want to do this because I want to overlay information on the image by specifying a particular latitude and longitude on the image. Although there is map projection information lower down on the web page, I can't even come close to setting up the same map projection space they show for the image. Can you help?
The image I am interested in is a Pine Island MODIS visible band image that can be downloaded from the web page either as a PNG file or as a GeoTiff file.
The projection information offered on the page contains the following information.
    Projection: Polar Stereographic    Datum: WGS84
   Standard Parallel: -70.0    Corner Coordinates:
       UL: 71.998860S 113.594373W        LL: 75.491196S 117.004071W
       UR: 72.492200S 98.868027W        LR: 76.115095S 98.568614W
   Number of Rows (MODIS): 1600    Number of Columns (MODIS): 2000
   Meters per Pixel (MODIS): 250
Here is a reduced-size replication of the image as it appears on the web page.
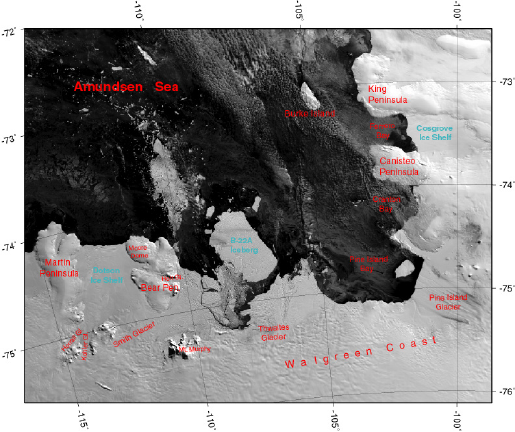 |
| The MODIS image as it appears on the NSIDC web page. |
![]()
ANSWER: This was a tough nut to crack for me, partly because I didn't know as much as I thought I did about polar map projections, which caused me to misunderstand some of the information on the web page, and partly because I think a piece of critical information for navigating the image was missing from the web page. (A common problem with web pages, by the way, that is more a statement about the state of data collections in general than negligence on the part of the data providers.) In any case, what I know now is that polar stereographic map projections (at least in IDL) always have their map origin at the poles, and there is almost always a "standard parallel" or "latitude of true scale" that describes a polar stereographic map projection. Normally, when a latitude of true scale is involved in a map projection in IDL, it is set with the True_Scale_Latitude keyword. However, this is not the case with a polar stereographic map projection. In this one particular case, you use the Center_Latitude keyword to set this property.
My intial thought was to set the map projection space up like this. Projection number 106 is the polar stereographic projection, and datum number 8 is the WGS84 Datum, when used with Map_Proj_Init.
mapStruct = Map_Proj_Init(106, DATUM=8, /GCTP, CENTER_LAT=-90.0, CENTER_LON=-70)
I made no headway at all using this map projection set-up with the PNG version of the image, so I tried the GeoTiff version of the image. Here is how I obtained the GeoTiff map projection information from the GeoTiff file and tried to learn something about it. Notice you almost always have to reverse the Y direction of images you read from TIFF files in IDL.
   file = 'pine_2009084_1545_modis_ch02.tif'
   image = Read_Tiff(file, GEOTIFF=geotag)    image = Reverse(image,2)
   Help, geotag, /STRUCTURE
      ** Structure, 18 tags, length=152, data length=150, refs=1:
         MODELPIXELSCALETAG              DOUBLE    Array[3]
         MODELTIEPOINTTAG                DOUBLE    Array[6, 1]
         GTMODELTYPEGEOKEY               INT              1
         GTRASTERTYPEGEOKEY              INT              1
         GEOGRAPHICTYPEGEOKEY            INT           4326
         GEOGCITATIONGEOKEY              STRING    'WGS-84'
         GEOGLINEARUNITSGEOKEY           INT           9001
         GEOGANGULARUNITSGEOKEY          INT           9102
         GEOGSEMIMAJORAXISGEOKEY         DOUBLE           6378137.0
         GEOGSEMIMINORAXISGEOKEY         DOUBLE           6356752.3
         PROJECTEDCSTYPEGEOKEY           INT          32767
         PROJECTIONGEOKEY                INT          32767
         PROJCOORDTRANSGEOKEY            INT             15
         PROJLINEARUNITSGEOKEY           INT           9001
         PROJNATORIGINLATGEOKEY          DOUBLE          -70.000000
         PROJFALSEEASTINGGEOKEY          DOUBLE          0.00000000
         PROJFALSENORTHINGGEOKEY         DOUBLE          0.00000000
         PROJSTRAIGHTVERTPOLELONGGEOKEY  DOUBLE          -100.00000
I have described elsewhere how to use the GeoTiff map projection tags to set up a map projection coordinate space. After a while (well, quite a while!) I noticed that the projection natural origin latitude was set to -70.0. I didn't read this closely and initially assumed this was the longitude as I had it in the map projection set-up I described above. When I finally noticed it was the latitude, I then noticed that the natural origin longitude key was missing. In its place was the the projection straight vertical from pole longitude key. This was a new one for me! But I decided to try a new map projection with these as the center latitude and longitude parameters, respectively, and all of a sudden it worked! Wow. Surprise! Notice that the map projection information on the web page doesn't mention this straight vertical from pole longitude (sometimes called the longitude of the map origin) at all, which leads me to conclude it is not possible to set up a map coordinate space from the information we were given initially. Or, at least, it is not easily possible. I suppose one could come up with some kind of iterative process in which the polar stereographic projection was rotated around until the projection grid was aligned properly, but I wouldn't want to write such a program!
So I proceeded to set up the map coordinate space. I decided to do this with a MapCoord object from the Catalyst Library, rather than with Map_Proj_Init, because I wanted to display this image in a resizeable graphics window that would allow me to interactively query the image value as well as the image location in map coordinate space. The MapCoord object is, essentially, a wrapper for the Map_Proj_Init command, and solves some of the problems with using the Map_Proj_Init command in widget programs. The Init method takes the same keywords you would use for Map_Proj_Init.
   mapCoords = Obj_New('MapCoord', 106, DATUM=8, /GCTP, CENTER_LAT=-70.0, CENTER_LON=-100)
   s = Size(image, /Dimensions)    xscale  = geotag.ModelPixelScaleTag[0]
   yscale  = geotag.ModelPixelScaleTag[1]
   tp      = geotag.ModelTiePointTag[3:4]    xOrigin = tp[0]
   yOrigin = tp[1] - (yscale * s[1])    xEnd = xOrigin + (xscale * s[0])
   yEnd = tp[1]    xrange = [xOrigin, xEnd]    yrange = [yOrigin, yEnd]
   mapCoords -> SetProperty, XRANGE=xrange, YRANGE=yrange
I then created a grid overlay to fit onto the image, and added it to the map coordinate object. The image object I am about to create will automatically draw grids, continental outlines and other map overlays if they are added to the map coordinate object.
   grid = Obj_New('Map_Grid', LONDEL=5, LATDEL=1, LATLAB=-107.5, LONLAB=-73.5, $
                  /LABEL, MAP_OBJECT=mapCoords)
   mapCoords -> SetProperty, GRID_OBJECT=grid
Finally, I create my image object and add the map coordinate object to that so that a map coordinate space is created for the image.
imageObj = Obj_New('ScaleImage', image, COORD_OBJECT=mapCoords)
If I want to add additional map overlays to the image, it is easy enough to do it now. For example, I might want to add text labels to identify certain locations in my image. I can do this by creating text objects and adding them to my image object, like this.
    text_1 = Obj_New('TextLine', 'Canisteo!CPeninsula', X=-102, Y=-73.8, ALIGNMENT=1, $
             COLOR='YELLOW', COORD_OBJECT=mapCoords)
    text_2 = Obj_New('TextLine', 'Walgreen Coast', X=-105, Y=-75.5, ALIGNMENT=1, $
             COLOR='YELLOW', CHARSIZE=1.5, COORD_OBJECT=mapCoords)
    imageObj -> Add, text_1     imageObj -> Add, text_2
When I get all this set up, I pass the image object to the ImgWin program and I have a resizeable graphics window with interative display of image values, map overlays, etc.
ImgWin, imageObj, Title='MODIS Pine Island Visible Image'
You see an example of the output in the figure below. A file of the commands shown here is available. You may have to change the name of the file to the file you downloaded to get the commands to work. And, of course, you will need the Coyote and Catalyst Library files on your IDL path.
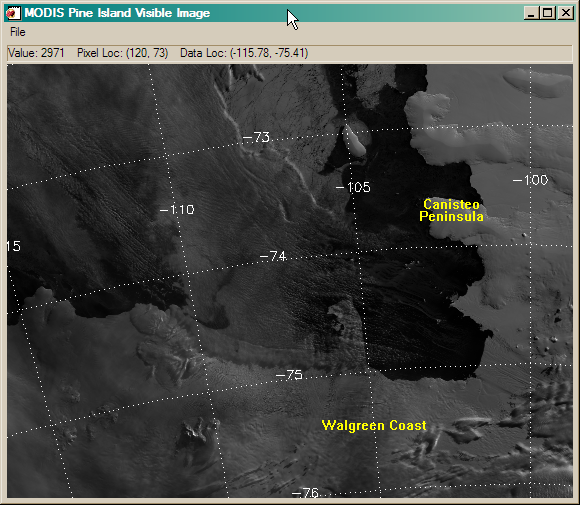 |
| The ImgWin program with the MODIS image. |
Navigating the PNG Image
Of course, you can do something similar to navigate the PNG image. In the process, you will learn about one additional small complication in navigating images like this. We begin by reading the image. In this case, we do not need to rotate the image in the Y direction. Here is code to read and display the image in an IDL graphics window.
   file = 'pine_2009084_1545_modis_ch02.png'    image = Read_PNG(file)
   pos = [0.1, 0.1, 0.9, 0.9]    cgLoadCT, 0, /SILENT
   cgImage, image, POSITION=pos, /KEEP_ASPECT, /NOINTERP, /ERASE, BACKGROUND='ivory'
We already know from working with the GeoTiff image above how to create the map projection. (Remember, the web page doesn't provide all the information you need.) This time, let's use the published longitudes and latitudes to calcualte our map projection range. The code will look like this. The latitudes and longitudes start in the upper-left corner and proceed clockwise (i.e., [UL, UR, LR, LL]).
   map = Obj_New('cgMap', 106, DATUM=8, CENTER_LAT=-70, CENTER_LON=-100, /ONIMAGE)
   lons = [-113.594373, -98.868027, -98.568614, -117.004071]
   lats = [-71.998860, -72.492200, -76.115095, -75.491196]
   xy = Map_Proj_Forward(lons, lats, MAP_STRUCTURE=map->GetMapStruct())
   xrange = [xy[0,0], xy[0,1]]    yrange = [xy[1,3], xy[1,0]]
The xrange and yrange variables now express the range in XY map coordinates or meters. But notice what happens if we divide the range by the map scale (number of meters/pixel) to obtain the size of the image in pixels.
   Print, 'XSize of Image: ', (xrange[1] - xrange[0]) / 250
   Print, 'YSize of Image: ', (yrange[1] - yrange[0]) / 250
The results are an X size 0f 1999 and a Y size of 1599. Oh, oh. Our image is 2000 by 1600. What does this mean?
It means that the published corners of images are often (almost always) representing the center of the corner pixels. In IDL we need to know the location of the outside edges of the corner pixels. The convention in GeoTiff files is to locate the origin or the tie point of the map projection at the outside edge of the UL corner pixel, which is why we didn't encounter this problem when we were navigating the GeoTiff image above.
To get the navigation correct, then, we have to move the xrange and yrange values we calculated above by a half a pixel in either direction, so they represent the outside edges of the corner pixels. A half a pixel, in this case, is 125 meters.
    halfpixel = 125
   xrange = [xrange[0] - halfpixel, xrange[1] + halfpixel]
   yrange = [yrange[0] - halfpixel, yrange[1] + halfpixel]
Now we can set up the map projection space and draw our grid in it.
    map -> SetProperty, XRANGE=xrange, YRANGE=yrange, /DRAW
   cgMap_Grid, LONDEL=5, LATDEL=1, LATLAB=-107.5, LONLAB=-73.5, $
        /LABEL, MAP_STRUCTURE=mapStruct
If we will to put annotations on the image, we must make sure we specify their locations in map projection coordinates. The easiest way to do that is to convert longitude/latitude coordinates to map XY coordinates with Map_Proj_Forward. For example, we can issue commands like this.
   xy = Map_Proj_Forward( [-102.25, -105], [-73.8,-75.5], MAP_STRUCTURE=mapStruct)
   cgText, xy[0,0], xy[1,0], 'Peninsula!CCanisteo', ALIGNMENT=0.5, $
	  COLOR='YELLOW', FONT=0
   cgText, xy[0,1], xy[1,1], 'Walgreen Coast', ALIGNMENT=0.5, $
	  COLOR='YELLOW', FONT=0
You see an example of the output in the figure below. A file of the commands shown here is available. You may have to change the name of the file to the file you downloaded to get the commands to work. And, of course, you will need the Coyote Library files on your IDL path.
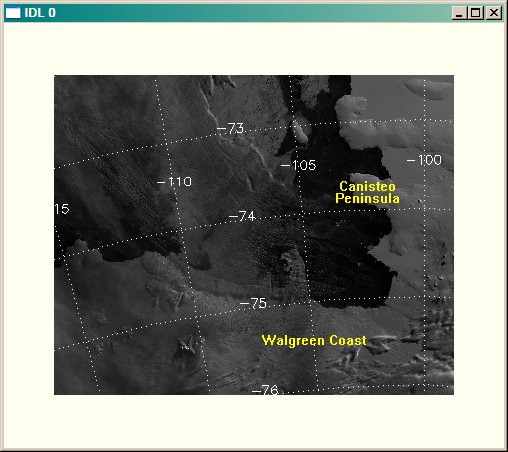 |
| The MODIS PNG image in an IDL graphics window. |
![]()
Version of IDL used to prepare this article: IDL 7.1.2.
![]()
Copyright © 2009 David W. Fanning
Written 15 June 2009
Last Updated 20 November 2011