
Overplotting in Function Graphics Routines


QUESTION: When I overplot data that is outside the original plot boundaries with function graphics routines, the data is not clipped to the plot boundaries as I expect. Am I doing something wrong? Here is an example of what I mean.
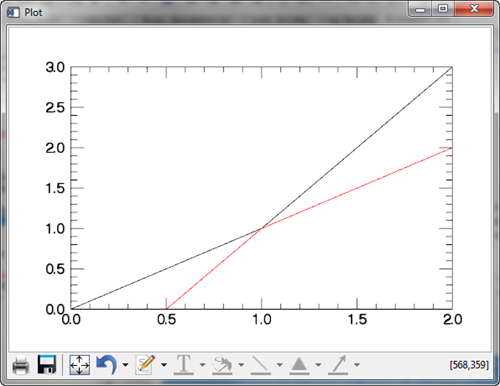
   p1 = Plot([0,1,3], YRange=[0,3])
   p2 = Plot([-1,1,2], /Overplot, Color='red')
 |
| An overplotted line is not clipped to the plot boundary using function graphics. |
![]()
ANSWER: You are not doing something wrong so much as misunderstanding the meaning of “overplot ” in the Function Graphics system.
[Editor's Note: The behavior described here in IDL 8.2.3 differs from the behavior in IDL 8.2.2. Since this article was first published, we have learned that this is a bug in IDL 8.2.3 and that a fix is available. See the Fix Available section below for instructions on how to restore the previous behavior.]
In the direct graphics system “overplot” means use the data range of the original plot to clip any subsequent data displayed on the plot. For example, like this.
   cgPlot, [0,1,3],yrange=[0,3]
   cgPlot, [-1,1,2], /Overplot, Color='red'
 |
| An overplotted line is clipped to the plot boundary using direct graphics. |
In the Function Graphics system “overplot” means use the same display window as the last function graphics command and add yourself to the graphics hierarchy currently existing in that display window. But, there is no notion of a clipping rectangle set up by the first plot.
If you wish to overplot in the direct graphics sense of the word, then you have to obtain the plot position and data ranges yourself and use them with the command you wish to overplot. You display the command in the current graphics window with the Current keyword.
   p1 = Plot([0,1,3], YRange=[0,3])
   p2 = Plot([-1,1,2], Color='red', Position=p1.position, $
            XRange=p1.xrange, YRange=p1.yrange, /Current)
 |
| Clipping an overplotted line to the plot boundary using function graphics. |
![]()
Fix Available
After this article was written, we learned that this overplot behavior in IDL 8.2.3 was a bug that was inadvertently introduced in this version. To fix the problem, you need to download two files from the ExelisVis web page. Download the file idlitvisdataspace__define file and save it to the $IDL_DIR/lib/itools/framework directory. Then, download the file idlitvisplot__define file and save it to the $IDL_DIR/lib/itools/component directory.A related clipping problem was discovered with with the Contour and Surface functions. To fix this you will need, in addition to the files above, the file idlitsrvcreatevisualization__define, which should be saved in the $IDL_DIR/lib/itools/framework directory.
After re-starting your IDL session, the overplot behavior should work as it used to.
Copy Files on Windows 7 Machines
Note that on a Windows machine running Windows 7, you cannot save the files into the correct directories directly, although there is no indication you can't do this if you try to do so. There is some kind of security protection in place that prevents the files from overwriting the old files. To make this work on my Windows machine, I copied the files into a local temporary directory, then dragged them into the correct directories specified above. This produced a dialog indicating I needed Administrator priviledge to write into the directory. Since I have Administrator privilege, I hit OK and the files were copied into the directory successfully.
![]()
Version of IDL used to prepare this article: IDL 8.2.3.
![]()
![]()
Updated: 16 June 2013


