
Problem Creating Grid with Plot Function


QUESTION: I am having a problem creating a grid with the IDL 8 Plot function. What I am looking for is something that looks like this direct graphics example. The documentation, such as it is, would seem to indicate that the Plot function keywords [XY]Ticklen and [XY]GridStyle work exactly like the direct graphics equivalents, but this doesn't seem to be the case. Can you help me?
![]()
ANSWER: I am afraid I can't. This appears to be a bug in all IDL 8 versions up through at least IDL 8.2.1, which is the current version I am testing.
The problem seems to be that the [XY]Ticklen and [XY]GridStyle keywords are being applied to both the major and minor tick marks simultaneously.
In direct graphics, we would do something like this.
cgPlot, cgDemoData(1), XTickLen=1.0, YTickLen=1.0 , XGridStyle=1, YGridStyle=1
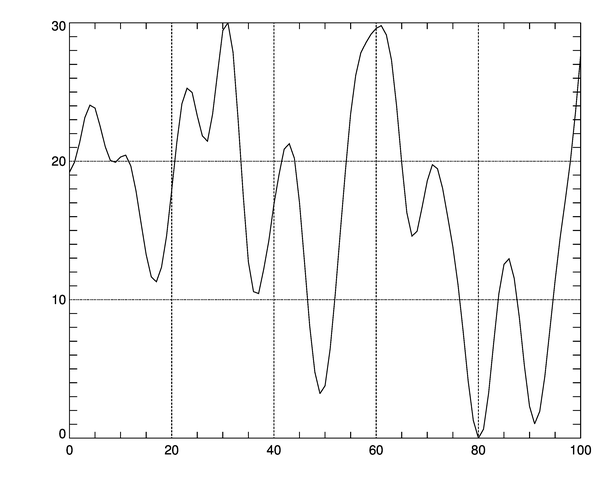 |
| A background grid in direct graphics. |
If we try to do the same thing with the Plot function in function graphics, we get this result.
p = Plot(cgDemoData(1), XTickLen=1.0, YTickLen=1.0 , XGridStyle=1, YGridStyle=1)
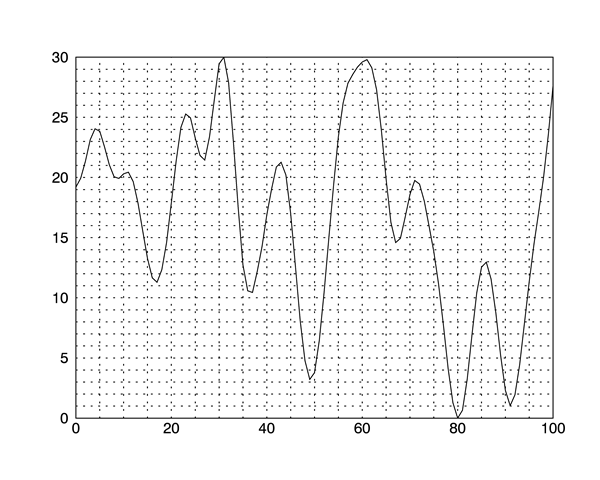 |
| A background grid in function graphics. |
If you can live without minor tick marks, you can, of course, suppress the minor tick marks to get a grid that is closer to what you want.
   p = Plot(cgDemoData(1), XTickLen=1.0, YTickLen=1.0 , XGridStyle=1, YGridStyle=1, $
         XMinor=0, YMinor=0)
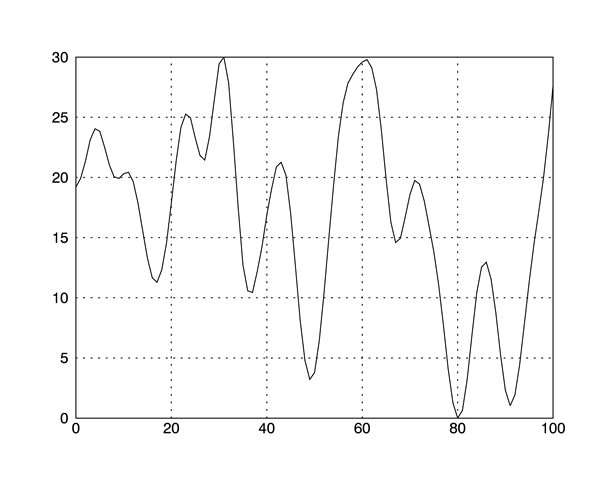 |
| A background grid in function graphics with minor ticks suppressed. |
![]()
Progress Report
We are apparently making slow progress with this problem. Here is the latest result in IDL 8.2.3.
p = Plot(cgDemoData(1), XTickLen=1.0, YTickLen=1.0 , XGridStyle=1, YGridStyle=1)
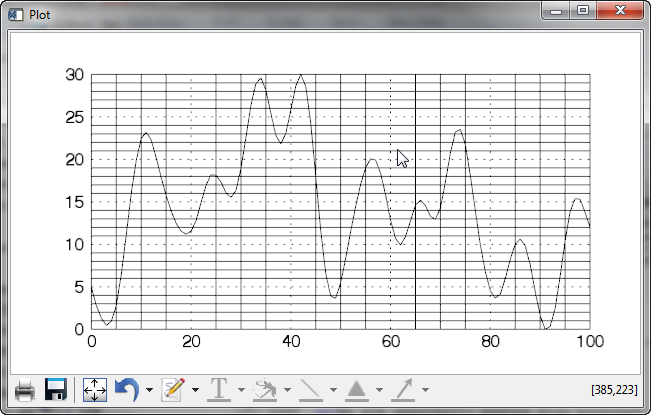 |
| A background grid in function graphics with IDL 8.2.3. |
![]()
Version of IDL used to prepare this article: IDL 8.2.1.
![]()
![]()
Updated: 18 June 2013


