
Window Refresh Appears Broken for Map Projections


QUESTION: I use function graphics commands to draw a map projection in a graphics window with box axes. Because creating box axes the way I like them requires quite a lot of "post processing," I generally turn window updating or refreshing off while I do this, then turn it back on when I am finished. But, this appears to be broken in IDL 8.2.3. All I get is a big cross in my refreshed window! Do you know what is going on?
![]()
ANSWER: No, I am afraid I don't. But, it does look like a bug that was introduced in IDL 8.2.3. As far as I can tell, this window refresh problem appears to only affect map projections. Line, contour, and image plots appear to be unaffected.
Editor's Note: This is apparently a known problem, but a fix is available. See the Fix Available section below.
Here is some code that illustrates the problem. The figure below it shows you what I expect to see.
   PRO Test_Good
       win = Window(DIMENSIONS=[500,350])
       IF Keyword_Set(refresh) THEN win.refresh, /Disable
       mp = Map('Equirectangular', CENTER_LONGITUDE=180, $
           BOX_AXES=1, GRID_LATITUDE = 30, GRID_LONGITUDE = 45, $
           LABEL_POSITION=0, LIMIT=[-89.99, 0, 89.99, 360], CURRENT=win)
       mp['Latitudes'].label_angle=90
       mp['Longitudes'].label_angle=0
       grid = MapGrid( $
           LONGITUDE_MIN=0, LONGITUDE_MAX=360, $
           LATITUDE_MIN=-90, LATITUDE_MAX=90, $
           GRID_LONGITUDE=45, GRID_LATITUDE=30, $
           LABEL_POSITION=1, CURRENT=win)
       FOREACH g,grid.latitudes DO g.label_angle=270
       FOREACH g,grid.longitudes DO g.label_angle=0
       c = MapContinents(COLOR=!Color.red)
   END
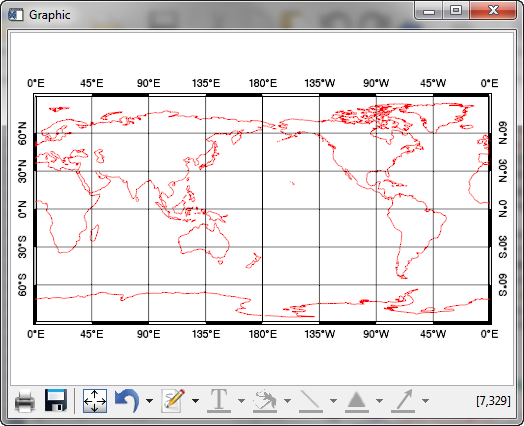 |
| What I expect to see in the graphics window. |
And, here is code where I disable the refresh until after I am finished manipulating the map projection. You see the difference in the figure below.
   PRO Test_Bad
       win = Window(DIMENSIONS=[500, 350])
       win.refresh, /DISABLE
       mp = Map('Equirectangular', CENTER_LONGITUDE=180, $
           BOX_AXES=1, GRID_LATITUDE = 30, GRID_LONGITUDE = 45, $
           LABEL_POSITION=0, LIMIT=[-89.99, 0, 89.99, 360], CURRENT=win)
       mp['Latitudes'].label_angle=90
       mp['Longitudes'].label_angle=0
       grid = MapGrid( $
           LONGITUDE_MIN=0, LONGITUDE_MAX=360, $
           LATITUDE_MIN=-90, LATITUDE_MAX=90, $
           GRID_LONGITUDE=45, GRID_LATITUDE=30, $
           LABEL_POSITION=1, CURRENT=win)
       FOREACH g,grid.latitudes DO g.label_angle=270
       FOREACH g,grid.longitudes DO g.label_angle=0
       c = MapContinents(COLOR=!Color.red)
       win.refresh
   END
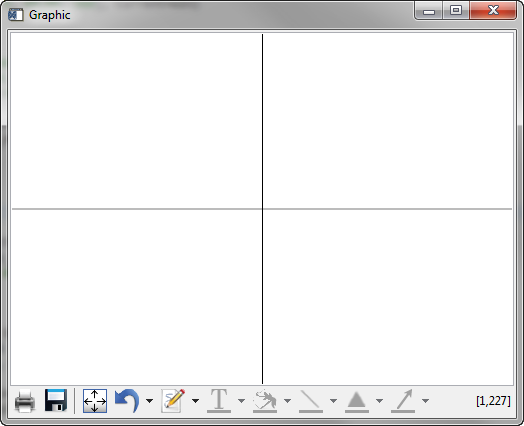 |
| What I see in the graphics window when I disable window refresh when manipulating the map projection code. |
![]()
Update on Bug
Note that if you manually push the third button from the left in the button bar at the bottom of the blank window (the button with the arrows pointing outwards on it), the correct plot will appear. Go figure!
![]()
Fix Available
This turns out to be a very narrow bug that applies only to map projections that are using the LIMIT keyword. (Well, almost all of mine!) By downloading a couple of programs from ExelisVis, you can solve the problem. Download the following two programs.
Save them to the !IDL_DIR/lib/graphics/ directory. The problem should be fixed once you restart IDL.
![]()
Version of IDL used to prepare this article: IDL 8.2.3.
![]()
![]()


