Image Processing Programs
The programs are written to do a number of image processing tasks.
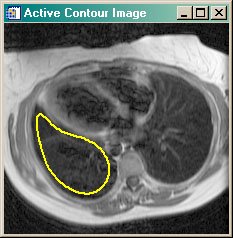
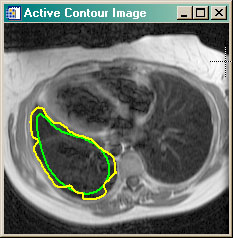
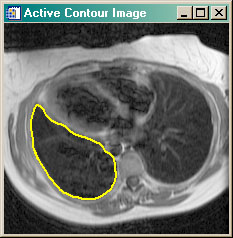
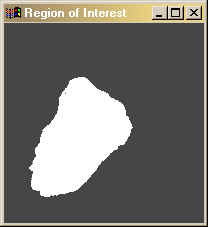
- ACTIVECONTOUR Active contour (or snake) example program. Uses GVF Active Contouring algorithm.
- cgASINHSCL Similar to BYTSCL, except that an inverse hyperbolic sine function is used for scaling.
- cgCLIPSCL Performs a linear byte scaling of data, with clipping on each end of the histogram.
- cgCOMPRESSSCL Compresses image
mid-tones in a scaling transformation.
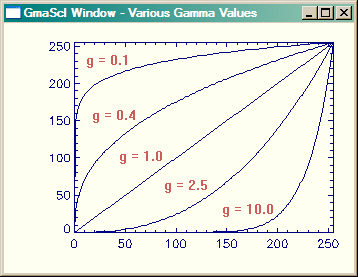
- cgGMASCL BYTSCL on steroids! Gamma as well as linear scaling.
- cgGAUSSSCL Performs a Gaussian scaling on image arrays.
- cgLOGSCL Like BYTSCL, only with a logrithmic scaling instead of linear scaling.
- cgSDEVSCL Like BYTSCL, but using the standard deviation of pixels to create scaling thresholds.
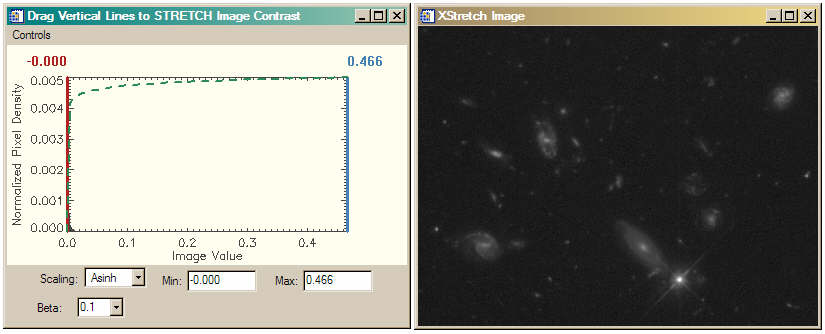
- cgSTRETCH Interactively increase image contrast with various image pixel transformations.
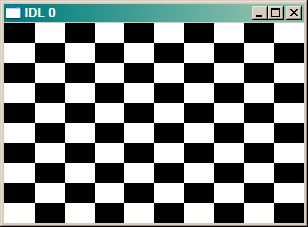
- CHECKERBOARD Creates a 2D checkerboard image.
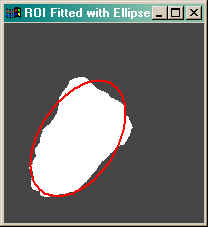
- FIT_ELLIPSE Fits an ellipse to a region of interest (known as a "blob").
- HIST_ND Calculates an N-dimensional histogram.
- HISTOMATCH Performs histogram matching on an image.
- SCALEMODIS Provides differential scaling to brighten MODIS reflectance images.
- SHARPEN Sharpens an image with a Laplacian kernel.


|
|
|
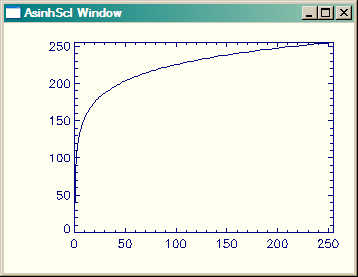
This is an image processing utility routine similar to cgGMASCL in that
it scales input data into the range of 0 to 255. But it uses an inverse hyperbolic sine scaling algorithm, rather than
a power-law (gamma) scaling algorithm. This is extremely useful when you have an image with a low
signal to noise ratio. It can compress the noise, which simulataneously expanding the signal.
You can specify both the minimum and maximun scaling
output values, and you can obtain a negative image by simply setting the Negative keyword.
The shape of the hyperbolic sine curve can be modified with a “softening” parameter, named beta. The input is scaled with the following equation before the
final output is scaled into the range 0 to 255:
scaled = ASINH(beta*image)
Here is a picture of what the output looks like when the input is INDGEN(256). Although the output
resembles a gamma function with the default beta parameter, the function can
be “tuned” to work with even those very difficult FITS images. The cgSTRETCH
program can be used as an interactive front end to this program.
|
|
|
|
This is an image processing utility routine similar to BYTSCL in that
it scales input data into the range of 0 to 255. But it differs in that a user-specified
percentage of pixels can be clipped from either end of the image histogram. The default it
to use a two percent clip. (What ENVI calls a linear 2% stretch.) Clipping is approximate,
and depends entirely on the image histogram. To clip 5 percent of the pixels from both ends
of the image histogram before stretching, type this command. The cgSTRETCH
program can be used as an interactive front end to this program.
IDL> cgImage, cgClipScl(image, 5)
|
|
|
|
This is an image processing utility routine similar to GMASCL in that
it scales input data into the range of 0 to 255. But it uses a compression scaling algorithm, rather than
a linear or gamma (power-law) scaling algorithm. This is extremely useful when you want to
compress information in
the upper and lower data values, while stretching the area around a mean value.
You can specify both the minimum and maximun scaling
output values, and you can obtain a negative image by simply setting the Negative keyword.
The center of the scaling curve can be set with a Mean keyword, and the slope of the curve can be
set by selecting higher values of Exponent. The input is scaled with this equation before the
final output is scaled into the range 0 to 255:
scaled = 1 / ( 1 + (mean/input)^exponent)
Here is a picture of what the output looks like when the input is INDGEN(256). The cgSTRETCH
program can be used as an interactive front end to this program.
|
|
|
|
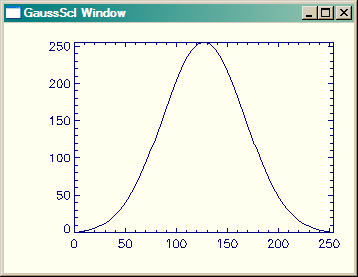
This is an image processing utility routine similar to cgGMASCL in that
it scales input data into the range of 0 to 255. But it uses an Gaussian (normal) scaling algorithm, rather than
a power-law (gamma) scaling algorithm. Interactive Gaussian stretching can be accomplished with
cgSTRETCH.
Here is a picture of what the output looks like with various Gaussian values when the input is INDGEN(256).
|
|
|
|
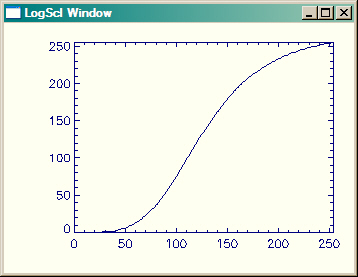
I think of this program as “BYTSCL on steroids!” It scales
image data in the manner of BYTSCL, but it also allows gamma log scaling in addition to
the standard linear scaling. Moreover, you can specify both the minimum and maximun scaling
output values, and you can obtain a negative image by simply setting the Negative keyword.
I wrote the program primarily to deal with gnarly FITS images with their often complex image
contrast requirements. For exploring image contrast, see cgSTRETCH, which is
an interactive graphical front end
for this program.
Here is a picture of what the output looks like with various gamma values when the input is INDGEN(256).
|
|
|
|
This is an image processing utility routine similar to cgGMASCL in that
it scales input data into the range of 0 to 255. But the shape of the curve is fixed, unlike
the shape in cgGmaScl, which is variable.
scaled = constant ( (1 + Double(image))
|
|
|
|
This is an image processing utility routine similar to BYTSCL, in that
it scales input data into the range of 0 to 255. But it uses the
standard deviation of pixels in the image to select upper and lower thresholds for the linear scaling. The standard deviation and mean
are calculated for the image (excluding any value specified with the
EXCLUDE keyword), then the standard deviation is multiplied by a
factor (specified with the MULTIPLIER keyword), before being
subtracted or added to the mean to select the lower and upper bounds
for a linear scaling.
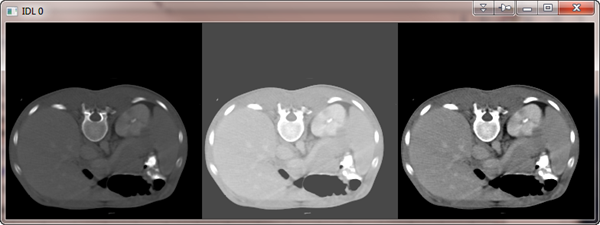
Here is an example of how the program can be used.
   image = cgDemoData(5)
   cgDisplay, 256*3, 256
   !P.Multi = [0,3,1]
   cgImage, image
   cgImage, cgSDevScl(image)
   cgImage, cgSDevScl(image, Exclude=0)
   !P.Multi = 0
Here is the output.
|
|
|
|
This widget program has been completely revised as a general purpose
contrast enhancer for 2D images. It allows the user to interactively apply
linear, gamma, log, or inverse hyperbolic sine stretches to an image. The user moves two threshold
bars over the histogram plot of an image and the specified stretch is applied
to the image data between the two threshold lines. For the log stretches, a third
line shows the general shape of the scaling function. The program has
been updated to allow both windows to be interactively resized, printed, as saved in a variety of file
output types. The
stretched image can be saved to the main IDL level. This program requires
a number of programs from the Coyote Library, which you can
download
as a single zip file. The program was updated on 6 September 2007 to
include four new stretches: (1) a linear 2 percent stretch, (2) a square root (log) stretch,
(3) a histogram equalization stretch, and (4) a Gaussian normal stretch.
|
|
|
|
This function returns a checkerboard image containing a user-specified number
of alternating colored boxes (default of 8 as in a real checkerboard). The default
image output size is 400 by 400, but can be specified by the user.
|
|
|
|
The purpose of this program is to calculate an N-dimensional histogram. Please don't ask me any questions
about it. I didn't write it, and I'm not even totally sure I understand it. It was written by J.D. Smith and made
available to the IDL community via the IDL newsgroup. I do know this: anything JD does is impressive. And the
amount of code in this program (well, to be more exact, the lack of code in this program) is tremendously
impressive. There is no one in the entire IDL community who understands histograms or vectorization better than JD.
|
|
|
|
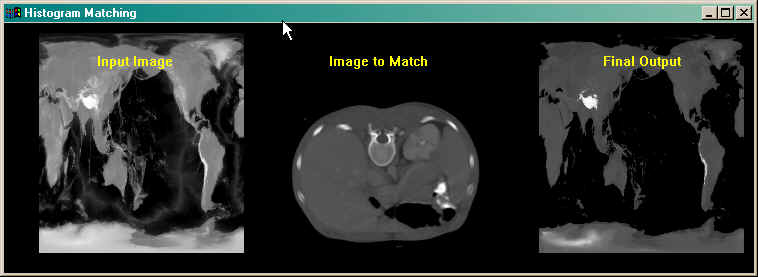
The purpose of this program is to perform "histogram matching" on an image.
Histogram matching is a process whereby the image pixel distribution is manipulated
to conform to the pixel distribution or histogram of another image. The final
pixel distribution of the image will approximate that of the input histogram.
For a more complete explanation of this process, see
Histogram Matching.
|
|
|
|
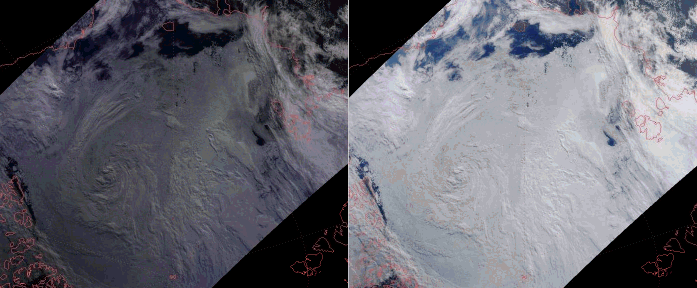
It is not uncommon for true-color and false-color images created
from MODIS reflectance channel data to appear dark and dingy. This
IDL program, can be used to apply the same differential
scaling the MODIS Rapid Response Team uses to produce the beautiful
MODIS true-color images on its web page. In the figure below, the image on the left was produced with simple byte scaling, while the image on the right was produced
by scaling with ScaleModis. See the article Bright MODIS Images
for additional details.
|
|
|
|
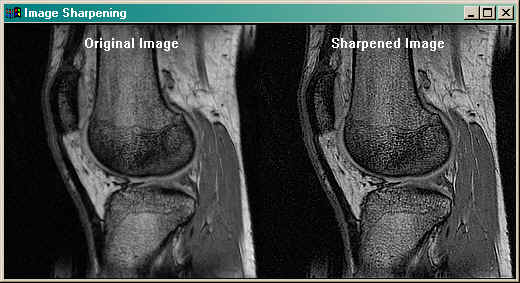
The purpose of this program is to sharpen an image with a Laplacian filter. Laplacian filters identify
edges in images. In sharpening, these edges are added back to the image to produce a "sharpening" effect.
For a more complete description of the method use, see the article
Image Sharpening with a Laplacian Kernel.
|
Copyright ©
1996–2018 Fanning Software Consulting, Inc.
Last Updated: 27 March 2015